
The October run is complete. I treated September 2026 as the comparison month and used the newest authoritative releases available as of October 1, 2026. The IMF’s full October World Economic Outlook is not scheduled for release until October 13, so the debt table uses the latest available IMF Fiscal Monitor and country-report estimates rather than pretending newer IMF figures already exist. IMF
Executive Assessment
The world economy enters October with a more difficult financial combination than it faced one month ago.
Economic growth has remained more resilient than many forecasts expected, particularly in the United States and in industries connected to artificial intelligence investment. At the same time, inflation pressure has returned through energy markets, central banks have resumed or continued tightening, and long-term government bond yields have climbed toward levels not experienced in decades.
The most important development during September was therefore not a collapse in economic activity.
It was the repricing of money.
The Federal Reserve raised its target range by 25 basis points to 3.75%–4.00% on September 16. The European Central Bank also raised its three key rates by 25 basis points, taking the deposit facility rate to 2.50%. The Bank of Japan increased its policy rate to 1.25%, its highest in 31 years. The Bank of England held at 3.75%, although three of nine policymakers preferred an increase to 4%.
The BIS describes the same phenomenon from the financial-market side: sovereign yields climbed as geopolitical tensions, inflation risk, fiscal burdens and higher term premiums converged.
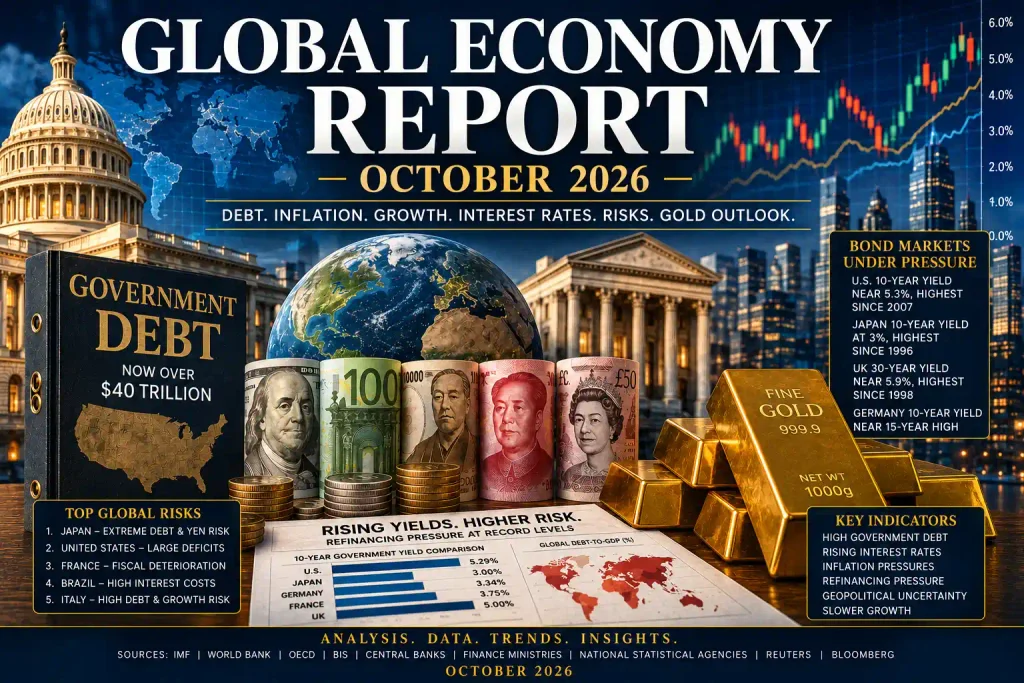
By September 29, the U.S. 10-year Treasury yield had reached approximately 5.293%, its highest since 2007, while the 30-year Treasury reached approximately 5.621%, its highest since 2002.
That changes the character of the global debt problem.
High debt is dangerous when interest rates are high enough to force governments, businesses and households to refinance at materially higher costs.
Major Economy Snapshot
Debt figures should be read carefully. IMF definitions vary across country reports, and newer country reports sometimes revise methodology. Japan, for example, recently shifted toward a consolidated face-value definition designed to improve international comparability. China’s conventional government-debt statistics also exclude substantial local-government financing exposures.
| Economy | Latest 2026 gross debt estimate | Current policy rate | Main October concern |
|---|---|---|---|
| Japan | about 203%–204% of GDP | 1.25% | Rising yields against enormous debt |
| Italy | about 138% | 2.50% ECB deposit rate | Refinancing and weak growth |
| United States | 125.8% IMF general government | 3.75%–4.00% | Deficits and 5%+ Treasury yields |
| France | 118.5% | 2.50% ECB deposit rate | Deficit, bond spreads and weak growth |
| Canada | about 110.9% gross | 2.25% | Gross debt but stronger net position |
| China | 106.9% IMF comparable measure | 3.00% 1-year LPR | Local-government and property liabilities |
| United Kingdom | about 101% | 3.75% | Inflation and long-duration gilt yields |
| Brazil | about 100% IMF broad measure | 14.00% | Extremely expensive debt service |
| India | 83.4% IMF Fiscal Monitor | 5.25% | Oil, inflation and rupee pressure |
| Germany | about 64% | 2.50% ECB deposit rate | Rising rates despite fiscal capacity |
| South Korea | 54.4% IMF Fiscal Monitor | 3.00% | Household debt and housing |
| Russia | 19.1% | 14.00% | Inflation, war expenditure and sanctions |
Sources include the IMF Fiscal Monitor and individual IMF country consultations.
United States
The United States experienced one of the largest changes since the September report.
The Federal Reserve raised its policy range from 3.50%–3.75% to 3.75%–4.00%, citing elevated inflation despite continued economic expansion.
August consumer prices were 3.4% higher than one year earlier, with gasoline up sharply during the month.
Economic growth nevertheless remained stronger than many expected. The Bureau of Economic Analysis revised second-quarter real GDP growth to an annualized 2.2%, following 2.5% in the first quarter.
This creates a difficult monetary combination:
growth is not weak enough to force the Fed to ease, while inflation is not low enough to permit easy money.
The fiscal side is equally important.
CBO estimates the federal deficit reached approximately $2.0 trillion during the first 11 months of fiscal 2026. Its February baseline projected a full-year deficit near $1.9 trillion, or 5.8% of GDP, with debt held by the public near 101% of GDP. Net federal interest expense is projected to exceed $1 trillion in 2026.
CBO’s September stress analysis illustrates how sensitive the outlook has become to rates. If interest rates ultimately run one percentage point above its extended baseline, CBO estimates debt held by the public could reach 222% of GDP by 2056, compared with 175% in its baseline.
October assessment
Fiscal risk: Very high
Monetary risk: High
Immediate default risk: Low
Refinancing pressure: Very high
Currency risk: Moderate
The most important U.S. number for October is no longer merely the Fed funds rate.
It is the 10-year Treasury yield.
A 10-year yield above 5% transmits directly into mortgages, business financing, commercial real estate, municipal borrowing and federal interest costs.
Japan
Japan remains the most structurally difficult sovereign balance sheet among the major developed economies.
The IMF’s revised methodology places gross debt near 203% of GDP, slightly below earlier estimates above 204% because the Fund changed its accounting treatment to a consolidated face-value approach. The IMF emphasizes that Japan also holds significant financial assets, although many are legally or operationally unavailable for routine government spending.
The Bank of Japan raised its policy rate in September to 1.25%, the highest level in 31 years.
That may appear low by U.S. or European standards, but Japan’s debt stock makes seemingly small interest-rate changes disproportionately important.
The policy dilemma is now unmistakable:
keeping rates too low risks renewed yen weakness and imported inflation; raising rates helps the currency and inflation fight but increases the government’s refinancing burden.
The yen remained volatile after the BOJ move, and markets continued monitoring the possibility of currency intervention.
Assessment
Fiscal-monetary risk: Extreme
Conventional default risk: Low
Currency risk: Very high
Refinancing sensitivity: Extreme
France
France remains the most important fiscal deterioration story inside the euro area.
The IMF expects gross government debt around 118.5% of GDP in 2026 and a general-government deficit around 5.2% of GDP. Growth is projected at only approximately 0.6%.
France’s problem is therefore not debt alone.
It is the combination of:
high debt, a large structural deficit, weak growth and increasingly expensive refinancing.
The ECB’s September rate increase to a 2.50% deposit rate makes that financing environment more demanding.
France also lacks the option available to countries with independent currencies of unilaterally directing its national central bank to create money.
The ECB may intervene to protect euro-area monetary transmission, but that protection is not equivalent to France controlling its own monetary policy.
Assessment
Fiscal risk: Very high and rising
Monetary flexibility: Limited nationally
Bond-market sensitivity: Very high
Italy
Italy’s debt remains higher than France’s, around 138% of GDP, but its fiscal trajectory is presently somewhat more controlled.
The IMF projects its overall government deficit around 2.9% of GDP for 2026.
Italy nevertheless remains exposed to:
higher ECB rates, weak productivity, aging demographics and renewed widening of Italian-German bond spreads.
Assessment
Fiscal risk: Very high
Near-term deterioration: Less severe than France
Refinancing risk: High
United Kingdom
The Bank of England kept Bank Rate at 3.75% in September, but the decision was 6–3; three officials wanted an immediate increase to 4%.
UK CPI inflation reached 3.1% in August, up from 2.9% in July. The Bank warns inflation is likely to rise further because of higher energy costs.
The Bank also reported that financial conditions have tightened considerably and that typical two-year fixed mortgage rates were around 95 basis points higher than before the latest energy shock.
Its Financial Policy Committee went further on September 30, saying the overall risk outlook had worsened and that vulnerabilities in sovereign debt, risky assets and credit markets were increasingly capable of crystallizing together.
Assessment
Fiscal risk: High
Inflation risk: High
Household borrowing risk: High
Bond-market risk: High
China
China’s one-year Loan Prime Rate remained at 3.00% and its five-year rate at 3.50% in September.
But Beijing introduced additional targeted credit and housing measures late in the month as domestic demand and property remained weak.
Manufacturing improved in September, with the official PMI returning to expansion at 50.1, supported partly by technology and AI-related demand. Second-quarter growth, however, had slowed to approximately 4.3%.
Debt definitions are particularly important in China.
The IMF Fiscal Monitor’s internationally comparable general-government measure puts 2026 debt around 106.9% of GDP. A narrower official-style budgetary measure is substantially lower, while IMF augmented accounts add local-government financing vehicles and other quasi-fiscal obligations.
China therefore illustrates why comparing headline debt ratios without examining government-controlled entities can be misleading.
Assessment
Formal sovereign risk: Moderate
Hidden public-sector risk: Very high
Property-sector risk: Very high
Currency risk: Moderate
Brazil
Brazil’s Selic target remains 14.00% after the central bank’s August reduction.
The IMF estimates general-government gross debt around 100% of GDP under its broad international definition, although the Brazilian authorities use a narrower measure closer to the high-80% range.
That definition difference matters, but it does not remove Brazil’s central problem:
the cost of money is extremely high.
A country with debt approaching the size of GDP and a 14% policy rate faces far greater debt-service pressure than a similarly indebted country borrowing at 2%.
Assessment
Fiscal risk: Very high
Interest-cost risk: Extreme
Currency flexibility: Helpful
Near-term monetary direction: Modestly improving
India
India continues to possess the strongest growth outlook among the largest economies, but its inflation and currency position worsened during September.
August inflation reached approximately 4.82%, above the RBI’s 4% target, while growth during April-June was near 8%. The RBI has held the repo rate at 5.25%, although a majority of economists surveyed by Reuters expect an increase at the October meeting.
India’s rupee declined during September as high oil prices and U.S. yields placed pressure on import-dependent economies. India imports approximately 90% of its crude oil, making the currency unusually sensitive to prolonged energy shocks.
Assessment
Fiscal risk: Moderate-high
Growth position: Strong
Oil and currency risk: High
Refinancing risk: Moderate
Canada
The Bank of Canada held its overnight rate at 2.25% on September 2. It cited continuing high energy prices and new trade uncertainty but described global activity as relatively resilient.
Canada’s gross government debt near 111% of GDP looks high, but its net debt position is dramatically lower because government and public pension assets offset a substantial portion of liabilities. The IMF estimates net general-government debt near only 10% of GDP.
That makes Canada an important example of why gross debt and net debt should not be treated as interchangeable measures.
Its greatest financial vulnerabilities remain housing, household leverage and mortgage refinancing.
Assessment
Sovereign fiscal risk: Moderate
Household debt risk: High
Housing risk: High
Germany
Germany continues to possess one of the strongest fiscal starting positions among large Western economies.
IMF estimates place general-government debt around the mid-60% range of GDP.
Germany nevertheless faces substantially higher borrowing costs because sovereign yields are rising throughout Europe.
This demonstrates an important principle:
a global bond selloff does not discriminate only against governments with poor finances.
Even strong borrowers pay more when inflation expectations, energy prices and global term premiums rise.
Assessment
Fiscal risk: Moderate-low
Growth risk: Moderate
Refinancing pressure: Rising from a strong starting position
South Korea
South Korea’s Base Rate stands at 3.00% after two consecutive increases from 2.50%.
The Bank of Korea says inflation is expected to stay above target for a prolonged period while exports and investment remain strong. It also identifies accelerating Seoul-area property prices and household-loan growth as financial-stability concerns.
South Korea’s IMF Fiscal Monitor debt ratio of approximately 54.4% of GDP remains considerably lower than most major advanced economies.
Assessment
Sovereign fiscal risk: Moderate-low
Household leverage risk: High
Export-cycle risk: Moderate
Russia
Russia’s key interest rate remains 14.00%.
The Bank of Russia expects 2026 inflation around 6%–7% and has declined to signal its next policy move because inflation and fiscal risks remain significant.
Russia’s government debt remains unusually low at approximately 19.1% of GDP, but that should not be interpreted as overall financial safety.
War expenditure, sanctions, restricted external financing, inflation and reduced transparency dominate the risk analysis.
Assessment
Sovereign leverage risk: Low
Monetary risk: Extreme
Geopolitical risk: Extreme
October Fiscal and Monetary Risk Ranking
This is a macroeconomic-risk ranking, not a prediction of sovereign default. It weighs debt, deficits, refinancing, monetary conditions, growth and currency vulnerability.
| Rank | Economy | Risk level | Change from September |
|---|---|---|---|
| 1 | Japan | Extreme | Worsened |
| 2 | United States | Very High | Worsened |
| 3 | France | Very High | Worsened |
| 4 | Brazil | Very High | Stable |
| 5 | Italy | Very High | Stable |
| 6 | United Kingdom | High | Worsened |
| 7 | China | High | Stable |
| 8 | India | Moderate-High | Worsened |
| 9 | Canada | Moderate | Stable |
| 10 | Russia | Mixed/High | Stable |
| 11 | South Korea | Moderate | Slightly higher monetary risk |
| 12 | Germany | Moderate-Low | Slight worsening |
The largest change is the United States, because a policy-rate increase has now been accompanied by long-term Treasury yields above 5%.
The Global Bond Market Is Now the Central Story
The September BIS Quarterly Review states that sovereign yields climbed as inflation, geopolitical uncertainty and concerns about fiscal sustainability increased term premiums.
By September 29:
U.S. 10-year Treasury: approximately 5.29%
U.S. 30-year Treasury: approximately 5.62%
Both are near multi-decade highs.
This matters because sovereign yields establish the foundation for much of the financial system.
When governments pay more, corporations generally have to pay even more.
Mortgages, commercial property loans, municipal debt and infrastructure financing then become more expensive.
The result can become self-reinforcing:
higher government debt leads investors to demand higher yields; higher yields increase government interest costs; larger interest costs increase deficits; larger deficits require more borrowing.
That does not automatically produce a crisis.
It does reduce governments’ room for error.
Currency Risk
The dollar strengthened through much of September as U.S. yields increased.
By October 1 the euro had fallen below approximately $1.13, a 17-month low, as European energy dependence, inflation and rising sovereign yields weighed on sentiment.
Japan’s yen remains vulnerable even after the BOJ’s rate increase.
India’s rupee was one of Asia’s weakest major currencies during the quarter, pressured heavily by crude-oil import costs.
The currency picture reinforces a broader pattern:
countries dependent on imported energy become especially vulnerable when oil prices and U.S. yields rise simultaneously.
Gold Outlook
Gold experienced a difficult September despite the deterioration in sovereign finances.
That apparent contradiction is extremely important.
Gold fell approximately 4% on September 28 and traded near $4,137 per ounce, with intraday prices dropping close to $4,110. Higher oil prices increased inflation expectations, which increased expectations for tighter monetary policy; Treasury yields and the dollar rose simultaneously.
After softer U.S. inflation data, gold began recovering on October 1 as expectations for another immediate Fed increase declined.
Central banks continue buying.
The World Gold Council reported net central-bank purchases of 23 tonnes in July, with approximately 130 tonnes purchased year-to-date at that point. China added about 20 tonnes during July.
The basic gold conflict remains:
long-term sovereign debt concerns support gold, while high real interest rates compete with gold.
Gold therefore performs best for debt-risk investors when fiscal concerns rise and real yields begin falling.
If debt concerns instead cause bond yields to rise sharply, gold can initially decline.
GoldBroker Perspective
GoldBroker’s September commentary concentrated heavily on rising sovereign borrowing costs.
Its September 25 analysis described gold as being caught between two opposing liquidity forces: central-bank or Treasury liquidity support on one side and rising long-term yields on the other.
Other September GoldBroker articles focused on French sovereign debt, global government refinancing and the possibility that gold could regain importance if governments become increasingly dependent on monetary intervention.
That thesis is relevant to this investigation, but GoldBroker is a commercial precious-metals company.
Its analysis should therefore be treated as a market viewpoint, not equivalent to IMF, BIS, OECD, central-bank or national-statistics evidence.
What Changed Since the September Report
September produced several material changes.
The Federal Reserve raised rates for the first time in this renewed tightening phase.
The ECB raised rates.
The Bank of Japan raised its policy rate to 1.25%.
U.S. 10- and 30-year Treasury yields moved above 5% and reached levels last seen in the mid-2000s.
UK inflation increased to 3.1%.
Euro-area inflation reached 3.2% in August.
Oil moved back toward or above $100 per barrel during portions of September.
India’s inflation and rupee pressure increased.
China introduced additional credit and housing support.
Gold suffered a major late-month correction despite continuing central-bank purchases.
The conclusion is that the world has shifted further away from the anticipated broad easing cycle.
Fifty-State Newspaper Sweep
A major or popular newspaper from each U.S. state was searched for September reporting related to inflation, debt, interest rates, housing, energy prices, employment or other developments relevant to this investigation.
The clearest new material came from five states.
California: The Los Angeles Times documented record diesel prices, higher inflation, rising Treasury yields and the direct effects of the Fed rate increase on household borrowing. It also reported the 10-year Treasury briefly above 5.27%.
Georgia: The Atlanta Journal-Constitution reported record diesel costs affecting farmers and freight operators and noted metro Atlanta motor-fuel costs were up approximately 31% from a year earlier.
Nevada: The Las Vegas Review-Journal reported 30-year mortgage rates returning above 7%, record diesel prices, and slower housing sales, showing how the national bond repricing is feeding directly into local housing affordability.
New Mexico: The Albuquerque Journal reported inflation and cost of living as the leading concern among surveyed families and separately documented continuing fuel-price pressure.
Pennsylvania: The Philadelphia Inquirer directly connected the rising national debt and interest rates with household affordability and also reported the consumer effects of the Fed’s September rate increase.
No meaningful new, independently accessible economic insight affecting this report’s conclusions was identified from the selected newspaper searches for Alabama, Alaska, Arizona, Arkansas, Colorado, Connecticut, Delaware, Florida, Hawaii, Idaho, Illinois, Indiana, Iowa, Kansas, Kentucky, Louisiana, Maine, Maryland, Massachusetts, Michigan, Minnesota, Mississippi, Missouri, Montana, Nebraska, New Hampshire, New Jersey, New York, North Carolina, North Dakota, Ohio, Oklahoma, Oregon, Rhode Island, South Carolina, South Dakota, Tennessee, Texas, Utah, Vermont, Virginia, Washington, West Virginia, Wisconsin and Wyoming.
Several of those publications blocked automated access. I therefore do not treat a blocked result as evidence that no relevant story existed; it means no sufficiently accessible September reporting from that selected publication could be verified for inclusion.
Consequences for Households
The sovereign debt problem increasingly reaches households through interest rates rather than through headlines about government debt.
A 10-year Treasury above 5% influences:
mortgage pricing, automobile financing, business loans, commercial property, municipal borrowing and investment valuations.
The Las Vegas Review-Journal reported the average U.S. 30-year mortgage returning above 7% during September.
Higher energy costs add another channel.
Diesel prices affect farming, trucking, groceries, construction and virtually every physical product that must be transported.
This creates the uncomfortable possibility that central banks may need to keep interest rates high while households are already being squeezed by energy and financing costs.
What to Watch During October
The most important indicator remains the U.S. 10-year Treasury yield.
The second is oil.
If oil remains close to or above $100 while Treasury yields remain above 5%, the combination would continue placing pressure on inflation, currencies, governments and households simultaneously.
The Bank of Japan deserves close monitoring because its next increases will test how much monetary normalization a government with debt above 200% of GDP can absorb.
France-Germany bond spreads should also be watched closely.
India’s October RBI meeting will reveal whether another major economy is joining the global tightening cycle.
The Federal Reserve meets again on October 27–28.
Finally, the IMF’s October World Economic Outlook will be released October 13. That report may revise the global growth, inflation and debt assumptions used here and should become the new official baseline for the November report.
Final Analysis
October begins with a more serious financial environment than September.
The central development is not that the world has suddenly entered recession.
Quite the opposite.
Growth has remained resilient enough that central banks cannot easily rescue bond markets by cutting rates.
Inflation has remained persistent enough that several central banks are raising rates again.
Governments simultaneously need enormous amounts of refinancing.
That combination explains why sovereign yields are moving upward.
The United States now deserves especially close attention because long-term Treasury yields have crossed 5% while deficits remain exceptionally large.
Japan remains the most structurally difficult large sovereign because even modest rate normalization occurs against debt exceeding twice annual GDP.
France remains Europe’s clearest fiscal deterioration risk.
Brazil continues paying extraordinarily high interest rates.
India has moved closer to monetary tightening because of inflation and oil.
China’s main concern remains the substantial amount of government-linked debt outside conventional central-government accounts.
Germany, Canada and South Korea remain comparatively better positioned from a sovereign-fiscal perspective, although each has important domestic vulnerabilities.
Gold’s September decline does not invalidate the sovereign-risk argument for holding gold.
Instead, September demonstrated something more useful:
sovereign risk is not automatically bullish for gold.
If sovereign concerns cause real interest rates and the dollar to rise, gold can decline.
If debt pressures ultimately force central banks toward monetary accommodation, financial repression or currency depreciation, the environment becomes substantially more supportive of gold.
The dominant global risk entering October is therefore best described as:
high debt meeting a higher cost of money.
That is now the core issue to watch.
Overall confidence: High on the direction of global refinancing and interest-rate pressure; medium-high on the relative fiscal vulnerability of the major economies; and medium to low on short-term forecasts for currencies, sovereign yields and gold.
The most significant October change is the move in U.S. long-term rates: the 10-year Treasury approaching 5.3% and the 30-year above 5.6% materially raises the refinancing pressure discussed in the August and September reports. reuters.com
Discover more from Rickey A. McElderry
Subscribe to get the latest posts sent to your email.